Let’s start with code and a picture:
library(maps)
map(“county”)

if you have a bit of population data from the US census, you can do a quick population map easily enough:

(no code because mine has the oddities of my data structures in it)
What’s nice is that these maps aren’t special, they are simply a vast array of points that define the boundaries! Just plotted by brute force.
Improving data by patching with other data sources
I had also some data on locations, and wanted to link them to a county. In 3% of cases there was no county, but we did have a latitude and longitude. A few googles indicated that the lat/long was correct even for the blanks (right on the roof actually…) So let’s patch together the data with a bit of R to fill in the blanks.
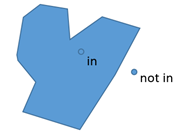
What do you mean “in”?
Obvious cases of when a point is inside an area are obvious:
Less obvious cases like lakes and offshore islands:
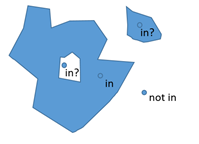
Things do get this bad in geography with the wonderful concept of exclaves or an island in a lake on an island in a lake on an island.
Probably means that there is a whole lot of things to consider when you detect if a point is inside a polygon. Things like ensure you are using the same projection of lat/long and reference points.
Library to the rescue!
Of course there is a library to do that, but they tend to start from a point of view of knowing what you are doing!
So eventually I googled a lot until I found the one that was most similar and simple:
https://gis.stackexchange.com/questions/133625/checking-if-points-fall-within-polygon-shapefile
https://stackoverflow.com/questions/26062280/converting-a-map-object-to-a-spatialpolygon-object?noredirect=1&lq=1
but basically:
-
Found a library that converts that data structure from maps library into a list of polygons
- (polygons are not a first class citizen in R language, but have a stable implementation supported by many libraries)
- Found the glue code to stitch together an arbitrary list of lat/longs into a structure that the SpatialPointDataFrame can accept into it’s constructor
- Then we are simply using the method over which does all the hard work
When I checked my end results things looked good! When comparing to a test set where I DID know the county in the original data I found that my lat/long lookup was correct in 99% of cases. The 1% left over was revealed on google maps to be within 100m of a county boundary, which feels explicable.. but bad enough that I don’t want to use this patching method unless I have to…
So I think I improved my data from being 3% bad to 0.03% bad.
Code looks like this but YMMV:
(as this was a hacked copy from the internet I’ve got some things that are not part of the tidyverse, which is my recommended style)
# https://stackoverflow.com/questions/8751497/latitude-longitude-coordinates-to-state-code-in-r
# tiny change from original code to do it for county as well
latlong2state <- function(pointsDF) {
# Prepare SpatialPolygons object with one SpatialPolygon
# per state (plus DC, minus HI & AK)
geo_states <- map(‘county’, fill=TRUE, col=”transparent”, plot=FALSE)
#IDs <- sapply(strsplit(geo_states$names, “:”), function(x) x[1])
states_sp <- map2SpatialPolygons(states, IDs=geo_states$name,
proj4string=CRS(“+proj=longlat +datum=WGS84”))
# Convert pointsDF to a SpatialPoints object
pointsSP <- SpatialPointsDataFrame(data.frame( pointsDF$longitude, pointsDF$latitude),
data= pointsDF,
proj4string=CRS(“+proj=longlat +datum=WGS84”))
# Use ‘over’ to get _indices_ of the Polygons object containing each point
indices <- over(pointsSP, states_sp)
# Return the state names of the Polygons object containing each point
stateNames <- sapply(states_sp@polygons, function(x) x@ID)
pointsDF$looked_up_bare_state_name <- sapply(strsplit(stateNames[indices], “,”), function(x) x[1])
pointsDF$looked_up_bare_county_name <- sapply(strsplit(stateNames[indices], “,”), function(x) x[2])
return(pointsDF)
}
# check it with a test set
test_county_checker <- latlong2state(stores %>%
select(year, store_number, store_name, latitude, longitude, original_bare_state_name, original_bare_county_name) %>%
slice(1:5000))
test_county_checker %>% filter(original_bare_county_name != looked_up_bare_county_name,
original_bare_state_name != looked_up_bare_state_name)

